Understanding Stackdriver Logging and its key features
Understanding Stackdriver Logging and its key features
Stackdriver Logging
Stackdriver Logging is used by the Google Cloud Platform (GCP) and Amazon Web Services (AWS) to store, search, analyze, monitor, and alert log data and events.
It is a fully managed service that performs at scale and you can ingest application and system log data from thousands of VM’s in real time.
Stackdriver Logging is a fully integrated solution and it works with
- Stackdriver Monitoring
- Trace
- Error Reporting
- Debugger.
This allows you to navigate between incidents, charts, traces, errors, and logs. It helps you quickly find the root cause of issues in your system and applications.
Features of Stackdriver Logging
- Stackdriver logging is designed to scale and works well at terabytes per second when consumed subsequently.
- It supports easy integration with Splunk and other partners.
- It lets you manage and analyze log data while running applications in a multi-cloud environment or migrating from one to the other.
- It analyzes high-volume application and system logs in real time.
- It has a public API which can be used to write any custom log, from any source, into the service.
- It uses a Google-customized and packaged Fluentd agent that can be installed on Google Cloud Platform VM to ingest log data from instances.
- Logs search is a powerful interface to search, slice and dice, and browse log data.
- Stackdriver monitoring enables you to set alerts on the log events, including the logs-based metrics that you have defined.
Logs Retention
Retention of logs allows you to keep the logs for 30 days in Stackdriver Logging, and provides a one-click configuration tool to store records in Cloud Storage for longer periods.
We export log data to Cloud Storage to archive,so you can store data for longer periods of time in a cost-effective manner.
In GCP Select Navigation menu> Logging> Logs Viewer.
To customize what logs you are viewing navigate to Stackdriver Logs Viewer.
- Service selector: filters by resource types
- Log selector: filters to specific log types of the resources selected
- Log level selector: filters to specific log levels
- Date selector: filters to specific date(s) in order to examine past issues
- Toggle continuous streaming
- A search box for text, label, or regular expression search, advanced filter
The Logs Viewer provides a variety of basic filters and advanced filters to tailor your search.
Filters
In Logs Viewer,
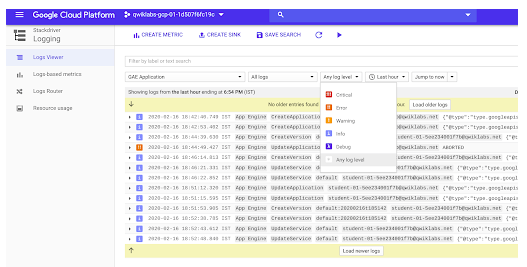
In the first (service selector) dropdown, select GAE Application > Default Service > All version_id as the service for which you want to view the logs.
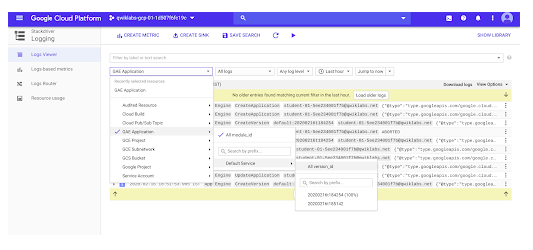
In the next (log selector) dropdown, select All logs.In All logs section we have found the appengine.
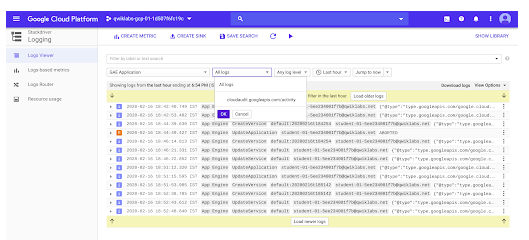
In the next (log level selector) dropdown, select Any log level.
The different log levels are
- critical
- Error
- Warning
- info
- debug
- Any log
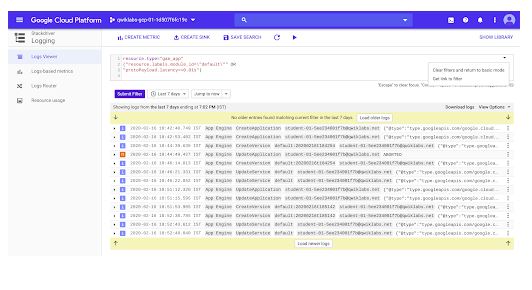
Advanced Filters
To search further in the Filter by label or text search dropdown, select Convert to advanced filter.
After converting to the Advanced filter we enter a specific type.
Example
resource.type= "gae_app"

resorce.labels.module_id="default"

protoPayload.latency>=0.01s
This protoPayload.latency line displays all GAE app logs with latency of greater than or equal to 0.01seconds.
Click Submit Filter and review the updated list of log entries, which show page loads longer than 0.01s.