
Pandas
Pandas
27 September 2023
Pandas is a Python library designed for analysis and data manipulation. It was created by Wes McKinney in 2008 and has since become an essential tool in the toolkit of data professionals. Here are some key characteristics that define Pandas: Pandas is built on top of the NumPy library, which is another powerful library in Python for numerical computations. This integration with NumPy gives Pandas its speed and efficiency, making it a preferred choice for handling large datasets.
Data Structures
Pandas provides fast, flexible, and expressive data structures designed to make working with “relational” or “labeled” data easy and intuitive. The two primary data structures in Pandas are DataFrames and Series.
- DataFrames: A DataFrame in Pandas is a 2-dimensional data structure, similar to a table with rows and columns. It’s incredibly versatile and can be thought of as the Python equivalent of an Excel spreadsheet.
- Series: A Series is a one-dimensional object that resembles an array and may store any kind of data. It is essentially a single column in a DataFrame, with an associated index that labels the data. Think of it as a single column of data in a spreadsheet.
Data Input and Output
Pandas excels at reading and writing data from various file formats, including CSV, Excel, SQL databases, JSON, and more. This versatility in data import and export is a game-changer when dealing with diverse data sources.
<h2class=”Black”>Install Pandas on Linux
we can update or get Pandas to the newest version in various methods based on how we installed Python. First, let’s look at installing Pandas on Linux using the pip commands.
Step 1: launch terminal-
To open terminal press alt + ctrl + t
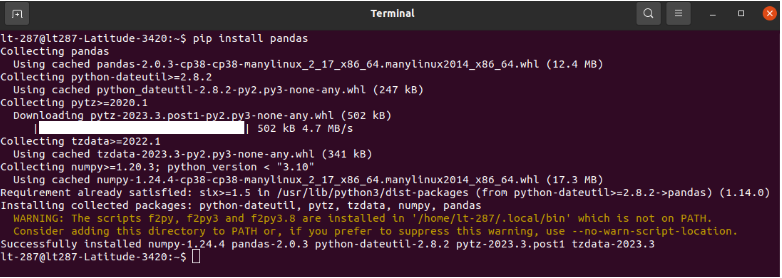
Step 2: Enter the command-
After opening the terminal we need to run the command for installing the pandas using pip
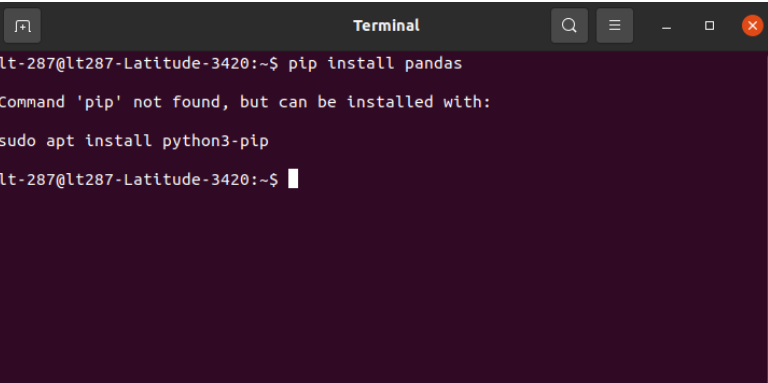
If you do not have pip installed on your system then you need to install the pip first and then pandas using pip
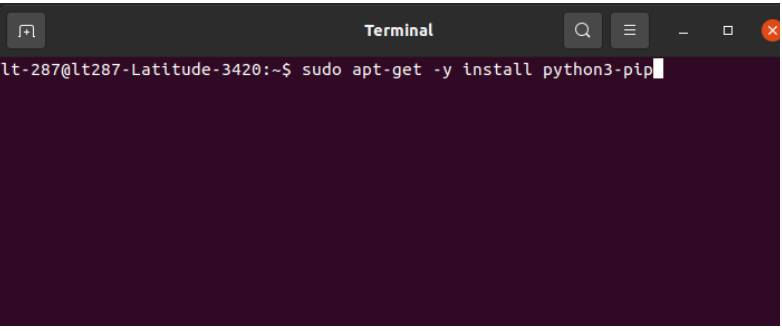
Run the command for installing the pip
Run the command to install Pandas (described above) after installing pip.
Step 3: Now you can use the pandas in your application
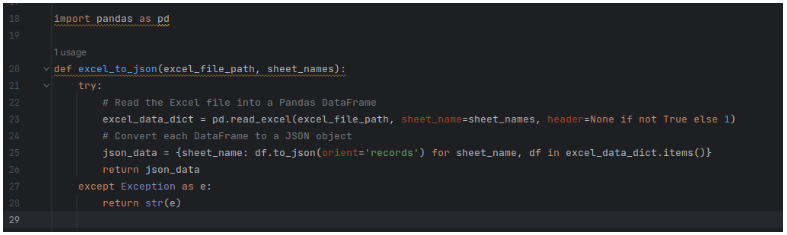
This Python code uses a helpful tool called Pandas to work with data stored in Excel files. It has a function that needs two things: the Excel file’s location and the names of the sheets you want to use from that file. When you run this code, Pandas helps it read and organize the data from those sheets. It then turns that data into a special kind of text called JSON. JSON makes the data easier to understand and work with, especially if you want to use it in other computer programs. If something goes wrong, like the Excel file is missing or has a problem, the code will catch the issue and tell you what’s wrong instead of crashing the whole program. So, it helps you handle data from Excel files more easily with the help of Pandas.
Working with Pandas
Now that we’ve covered the basics, let’s delve into how Pandas can be a game-changer for your data manipulation tasks.
Data Cleaning:
Messy data is a common problem in data analysis. Pandas provides an extensive suite of functions and methods for data cleaning, transformation, and manipulation. You can filter rows, select columns, handle missing values, and reshape your data with ease. It’s like having a cleaning crew for your datasets!
Data Transformation:
Pandas allows you to transform your data effortlessly. You can aggregate data, perform statistical operations, and reshape it to meet your analysis needs. With just a few lines of code, you can pivot, stack, or melt your data to create new insights.
Data Integration:
Working with multiple datasets? Pandas offers seamless ways to merge or join DataFrames, making it easy to combine and analyze data from different sources. You can perform inner, outer, left, or right joins, just like in SQL.
Data Analysis:
Once your data is clean and structured, Pandas provides the tools to perform in-depth analysis. You can calculate descriptive statistics, group data, and apply complex transformations to extract meaningful insights.
Data Visualization:
While Pandas itself is not a data visualization library, it integrates seamlessly with libraries like Matplotlib and Seaborn to create stunning visualizations from your data.
Advantages
- Effective Data Handling: Pandas makes tabular data handling and analysis, including data cleansing and transformation, simpler.
- It provides strong capabilities for working with time series data, which are necessary for financial and temporal analysis. Powerful Time Series Support.
- Pandas interfaces with data visualization frameworks without a hitch, making it simple to produce illuminating charts and plots.
- Wide-ranging Community and Ecosystem: Its sizable user base guarantees comprehensive support, documentation, and interoperability with many data types.
Disadvantages
- For really big datasets, high memory utilization is inappropriate.
- Restrictions on performance for complicated procedures
- Not the best for processing data in real-time.
- little parallelism built-in.
Conclusion
Pandas is a must-have tool for anyone working with data in Python. Its powerful data structures, versatile functions, and compatibility with various file formats make it an invaluable asset for data manipulation and analysis tasks. Whether you’re cleaning up messy data or conducting in-depth statistical analysis, Pandas has got you covered. So, if you haven’t already, it’s time to add Pandas to your data science toolkit and unlock its full potential for your data-related endeavors.