Data Preprocessing and Data prediction using Scikit learn
Data Preprocessing and Data prediction using Scikit learn
Machine Learning
Machine learning is the study of statistical models and algorithms by the computer to perform the task without programing explicitly. You can say, its an application of Artificial intelligence (AI), which focuses on relying patterns and inference to learn from data.
How Machine Learning works:
It works on training the algorithmic models to predict the patterns from the collection of data (Examples: images, speed recognition, system logs, and etc. Mathematically, it is totally based on the mathematical equations to get the result.
Example
Linear regression: Y = a + b.x
Multiple Linear regression: Y = a + b1.x1 + b2.x2 + b3.x3
Polynomial regression: Y = a + b1.x1 + b2.x2^2 + b3.x3^3
Use Cases:
- Product recommendations based on customer behavior
- Potentially fraudulent transactions
- Translate languages in text or audio
- Predict weather patterns.
- Enable software to accurately respond to voice commands
- Categorize images (such as MRI studies, photos, or satellite imagery)
Data flow diagram:
Collecting row data=> Manipulate the raw data which can be analysis(data preparation)=>Run the model (ML engine)=>Result ( predict the Analytical data).
Scikit learn python library
: It is an open source python library for data analysis and data mining. It is based on the machine learning library “Numpy“.
Data Processing
Use Case:
Let’s say, we have row data in the data.csv file, which has the salary of employees with years of experience in a company. Now, we need to build a model which predicts the salary for new employees based on the salary and year of experience which company offers.
Now, we need to process this row data which can be used for analytics and Data prediction. For this task, we will use Scikit learn python library.
Steps for Data Preparation/preprocessing:
- Import the library and the data set.
- Dependent variables and Independent variables: Identify which data is dependent, Move to depend matrix (Let’s say x) and which are independent data, move to independent matrix (Let’s say Y).
- Handling Missing data if any: If there is any missing data in any column or multiple column, then we need to handle it explicitly. Let’s say taking MEAN of a column.
- Categorical Data if any: If there is Categorical data present, Let’s say Delhi, Mumbai, pune. Then, we can create categories of them like 1 (for Delhi), 2 (for Mumbai), 3 (for Pune). Here, we need to create a dummy variable too.
- Splitting dataset into training set and Test set: Split the entire data set in training and test sets in ration of 80% and 20%. NOTE: It totally depends on the size of your data set.
- Feature Scaling/Normalization if only required: If the range of independent variables are large, then to normalize the range, we need to use feature scaling.
Code Block:
Before starting with the code, please make sure to set your working directory where you have saved the Data.csv file.
Create a file “Data_preprocessing.py”
#Importing Libraries

import numpy as np

import matplotlib.pyplot as plt

import pandas as pd


#Importing Datasets

dataset=pd.read_csv('Data.csv')


#Creating matrix of dependent and independent variable

# independent variables representing with X

X=dataset.iloc[:,:-1].values

Y=dataset.iloc[:,3]


#Taking of missing data with help of SimpleImputer class

from sklearn.impute import SimpleImputer as si

imputer=si(missing_values=np.NaN, strategy="mean")

imputer=imputer.fit(X[:,1:3])

X[:,1:3]=imputer.transform(X[:,1:3])


#Encoding the Categorical data from dataset

from sklearn.preprocessing import LabelEncoder, OneHotEncoder

labelencoder_X=LabelEncoder()

X[:,0]=labelencoder_X.fit_transform(X[:,0])

onehotencoder=OneHotEncoder(categories='auto')

X=onehotencoder.fit_transform(X).toarray()


labelencoder_Y=LabelEncoder()

Y=labelencoder_Y.fit_transform(Y)


#Splitting the dataset into training set and test set

from sklearn.model_selection import train_test_split

X_train, X_test, Y_train, Y_test = train_test_split(X,Y, test_size=0.2, random_state=0)


#Feature scaling

from sklearn.preprocessing import StandardScaler

scale_X=StandardScaler()

X_train=scale_X.fit_transform(X_train)

X_test=scale_X.transform(X_test)
Once the data processing gets done, we are ready to analyze the test set and predict.
Data prediction with Simple Learn Regression method
Code Block:
Before starting with the code, please make sure to set your working directory where you have saved the Salary_Data.csv file.
Create a file “simple_linear_regression.py”
# Importing the libraries

import numpy as np

import matplotlib.pyplot as plt

import pandas as pd


# Importing the dataset

dataset = pd.read_csv('Salary_Data.csv')

X = dataset.iloc[:, :-1].values

y = dataset.iloc[:, 1].values


# Splitting the dataset into the Training set and Test set

from sklearn.model_selection import train_test_split

X_train, X_test, y_train, y_test = train_test_split(X, y, test_size = 1/3, random_state = 0)


# Feature Scaling

"""from sklearn.preprocessing import StandardScaler

sc_X = StandardScaler()

X_train = sc_X.fit_transform(X_train)

X_test = sc_X.transform(X_test)

sc_y = StandardScaler()

y_train = sc_y.fit_transform(y_train)"""


# Fitting Simple Linear Regression to the Training set

from sklearn.linear_model import LinearRegression

regressor = LinearRegression()

regressor.fit(X_train, y_train)


# Predicting the Test set results

y_pred = regressor.predict(X_test)


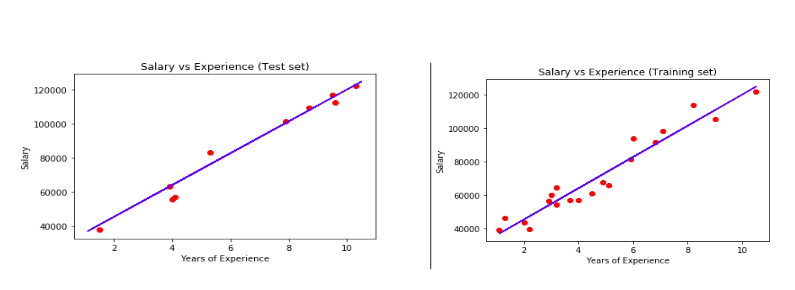
# Visualising the Training set results

plt.scatter(X_train, y_train, color = 'red')

plt.plot(X_train, regressor.predict(X_train), color = 'blue')

plt.title('Salary vs Experience (Training set)')

plt.xlabel('Years of Experience')

plt.ylabel('Salary')

plt.show()


# Visualising the Test set results

plt.scatter(X_test, y_test, color = 'red')

plt.plot(X_train, regressor.predict(X_train), color = 'blue')

plt.title('Salary vs Experience (Test set)')

plt.xlabel('Years of Experience')

plt.ylabel('Salary')

plt.show()


Summary:
So, we have successfully built a model, which can predict the salary of new employees which company should offer based on the result of the statistical test set..


