How to Do Load Testing Using Selenium & JMeter?
How to Do Load Testing Using Selenium & JMeter?
About Load Testing using JMeter tool:
In terms of software testing process, performance testing is a non-functional testing process which works on the particular work loaded application, web application or system to determine how the application performs in terms of particular workload and how much the application is stable in workload situation. JMeter is an open source load testing tool to test the performance of static resources such as JavaScript and HTML, and also to test dynamic resources, such as JSP, Servlets, and AJAX. JMeter is provided with various graphical analyses reports of the performance test.
Requirements:
- Java Version 8 or 9
- Selenium WebDriver
- ChromeDriver
- JUnit Framework
- Apache JMeter 4.0 https://jmeter.apache.org/download_jmeter.cgi
- Custom Plugins for Apache JMeter https://jmeter-plugins.org/
- Selenium/WebDriver Support – JMeter Plugins
JMeter Installations:
- To install, simply unzip the zip/tar file into the directory where you want JMeter to be installed.
- Provided that you have a JRE/JDK correctly installed and the JAVA_HOME environment variable set, there is nothing more for you to do.
- You need to add all the selenium web driver support – JMeter plugins jars inside the JMeter lib folder.
Create a Selenium Script:
- You need to create a web driver script to run the application.
- Export the jar file of the web driver project.
- Insert the exported project jar file inside the JMeter => Lib => JUnit folder.
How to run JMeter:
- To run JMeter, run the jmeter.bat (for Windows) or JMeter (for Unix) file. These files are found in the bin directory.
- We can run using JMeter interface or directly on JMeter server using command line arguments.
Steps to set up the JMeter interface you have the ability to create a new Test Plan from an existing template:
- To create a new test plan: Click on menu File => New button.
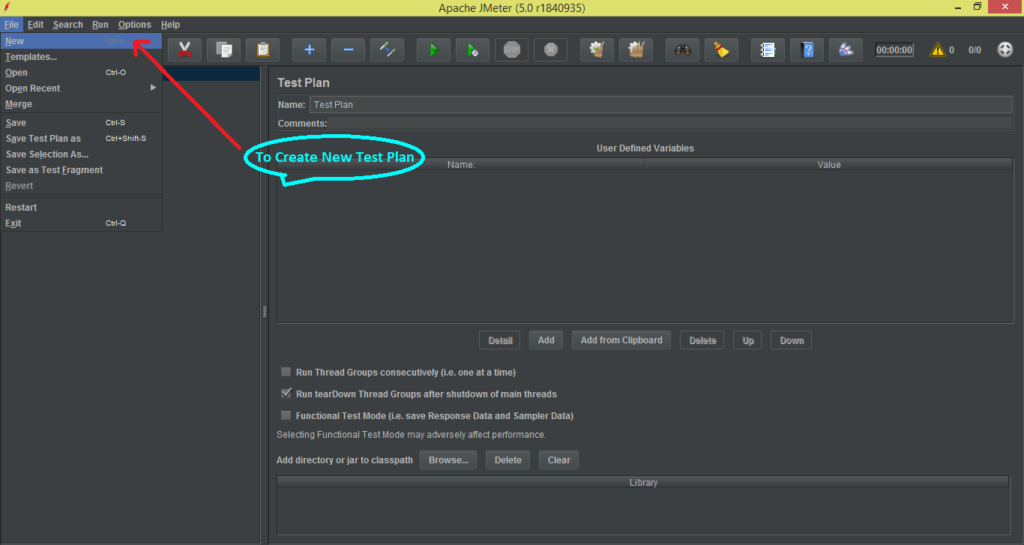

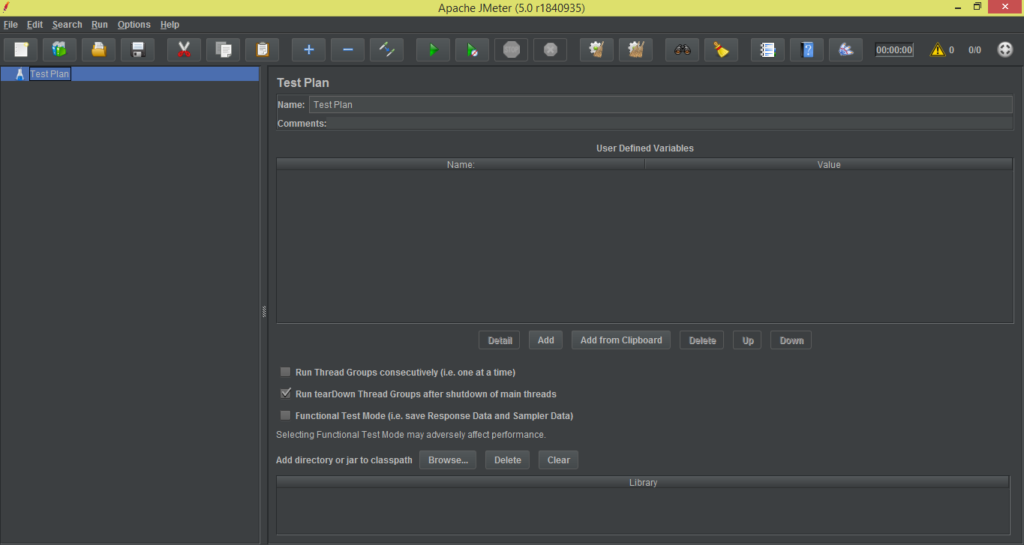
To do so you use the menu File → Templates… or Templates icon: You will see the new test plan as shown below:

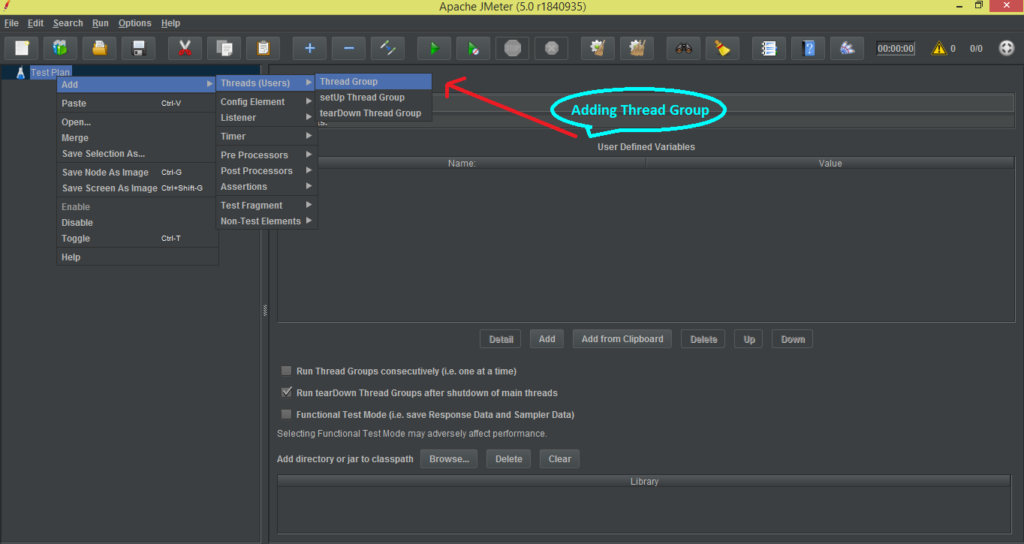
- To add Thread Group, right click on your ‘Test Plan‘ => ‘Add‘ => ‘Threads (Users)‘ => ‘Thread Group‘ button as shown below.

You will see the ‘Thread Group‘ as shown below:
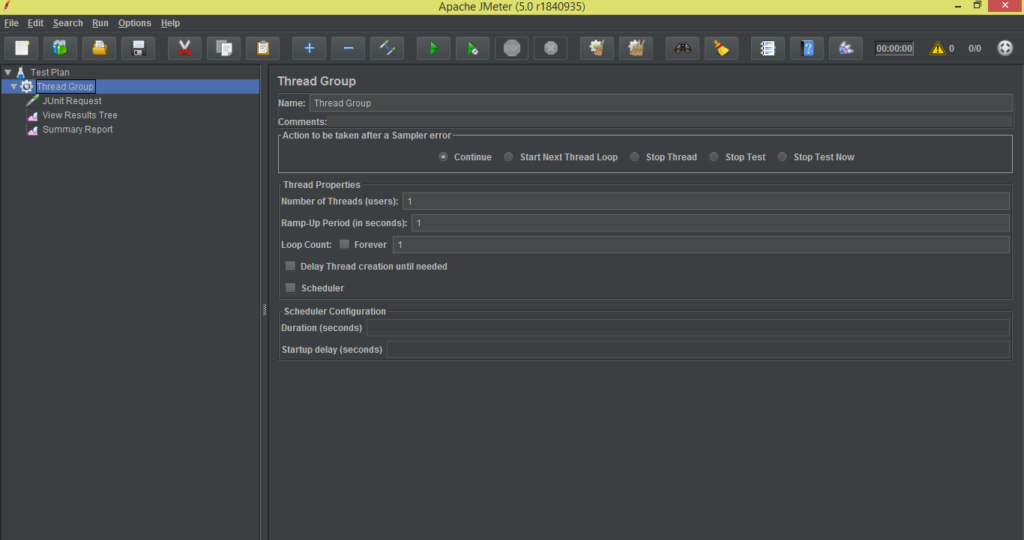

- Now, we need to add sampler i.e. JUnit Request
- To add JUnit Request: Right Click on ‘Thread Group‘ => ‘Add‘ => ‘Sampler‘ => ‘JUnit Request‘ button as shown below.
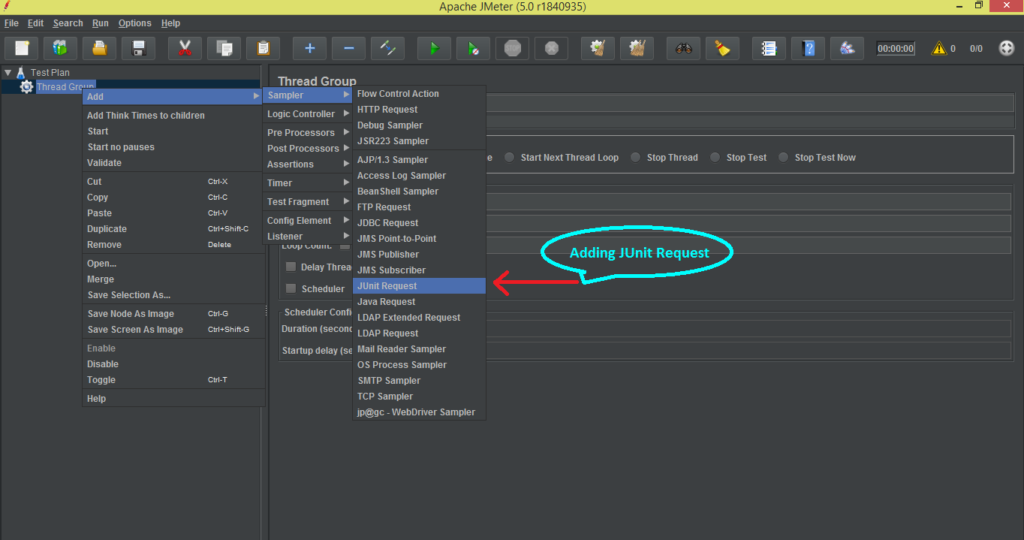

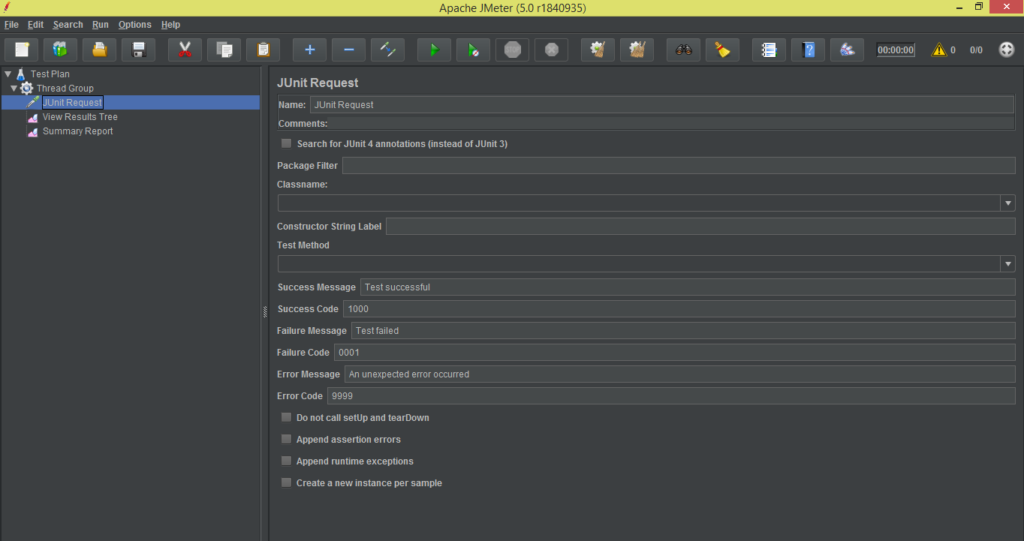
You will see the ‘JUnit Request‘ as shown below:

- Now, we need to add listeners i.e. ‘View Result Tree‘ to see the sampler results.
- To add View Result Tree: Right Click on ‘Thread Group‘ => ‘Add‘ => ‘Listeners‘ => ‘View Result Tree‘ button as shown below.
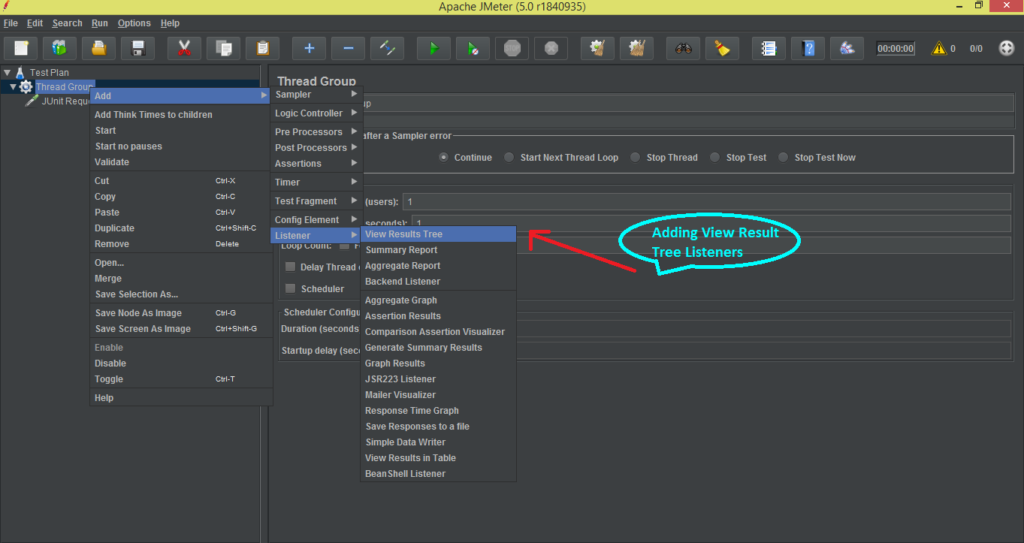

You will see the ‘View Result Tree‘ as shown below:
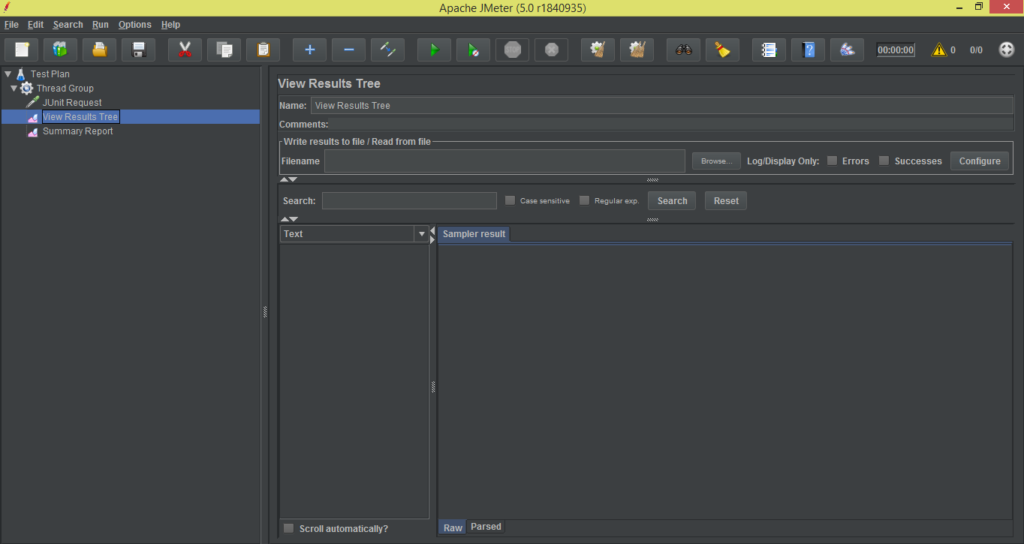

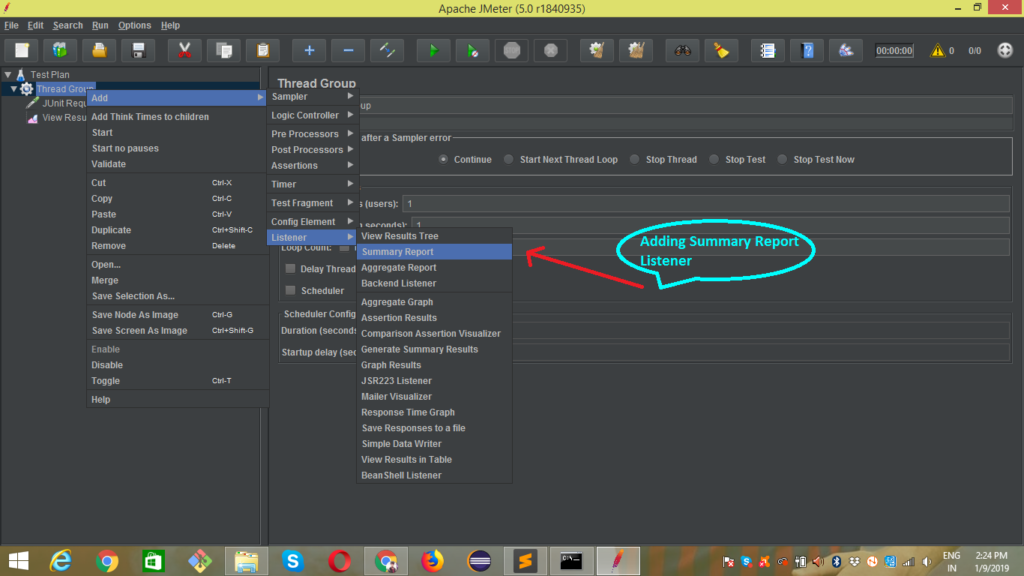
- Now, we need to add listeners i.e. ‘Summary Report‘ to see the whole summary of sampler results.
- To add Summary Report: Right Click on ‘Thread Group‘ => ‘Add‘ => ‘Listeners‘ => ‘Summary Report‘ button as shown below.

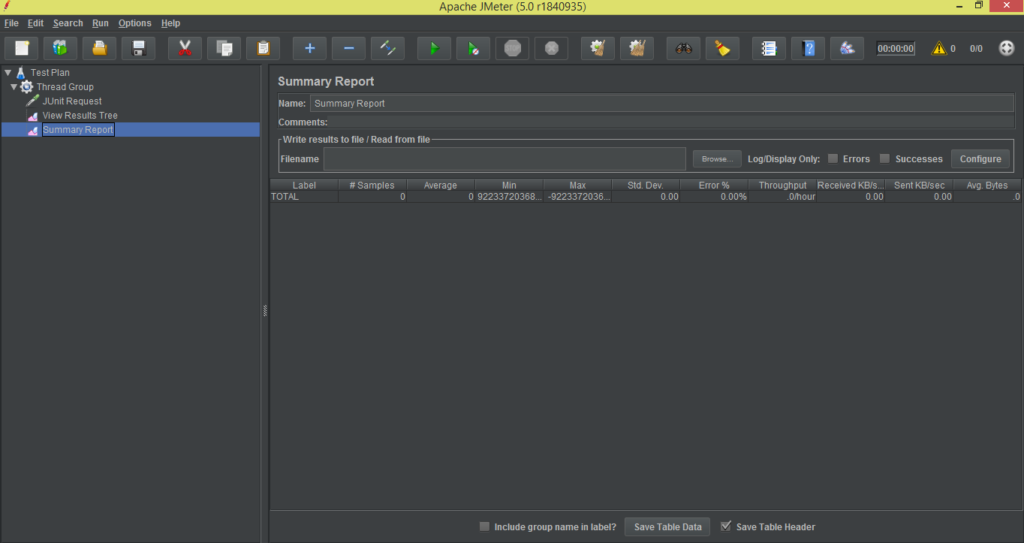
You will see the ‘Summary Report‘ as shown below:

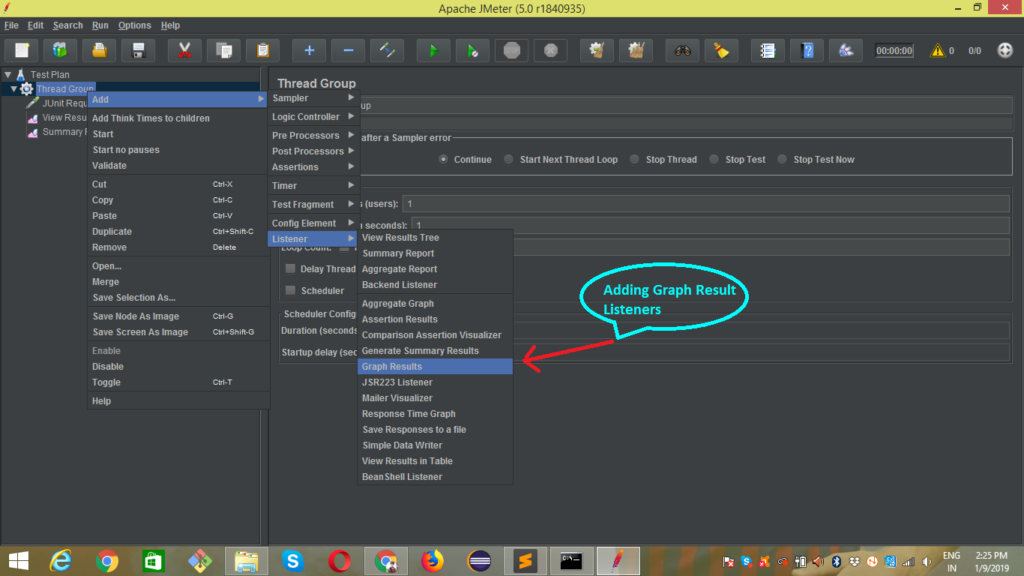
- Now, we need to add listeners i.e. ‘Graph Results‘ to see the whole summary of sampler results.
- To add Graph Results: Right Click on ‘Thread Group‘ => ‘Add‘ => ‘Listeners‘ => ‘Graph Results‘ button as shown below.

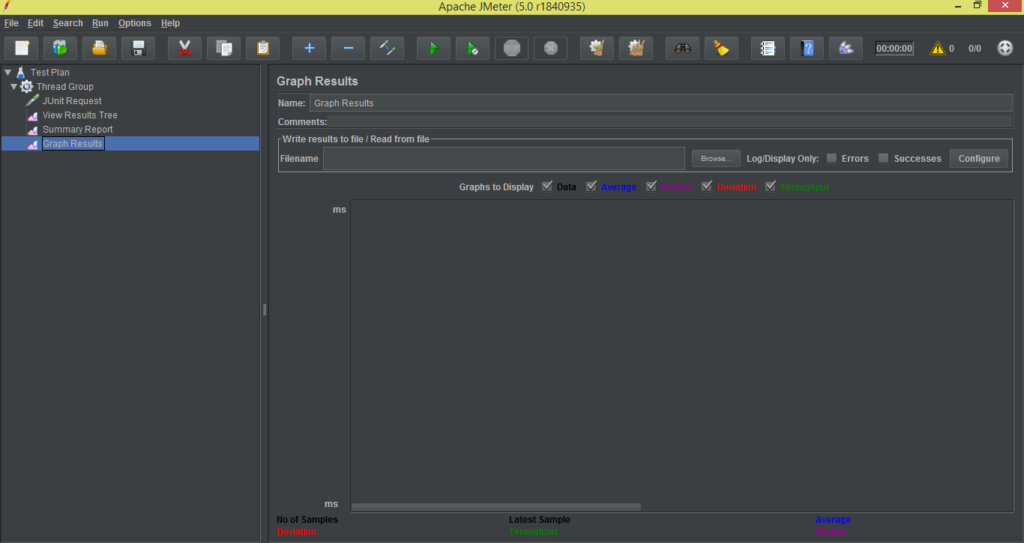
You will see the ‘Graph Results‘ as shown below:

- Now, we need to add data writer listener i.e. ‘Simple Data Writer‘ to create the CSV file of the sampler results.
- To add Simple Data Writer: Right Click on ‘Thread Group‘ => ‘Add‘ => ‘Listeners‘ => ‘Simple Data Writer‘ button as shown below.
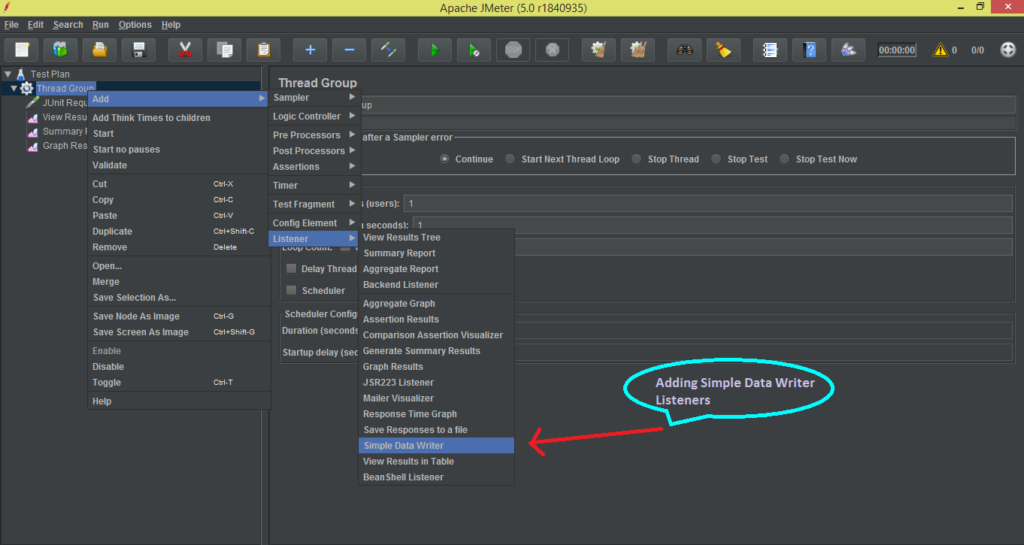

You will see the ‘Simple Data Writer‘ as shown below:
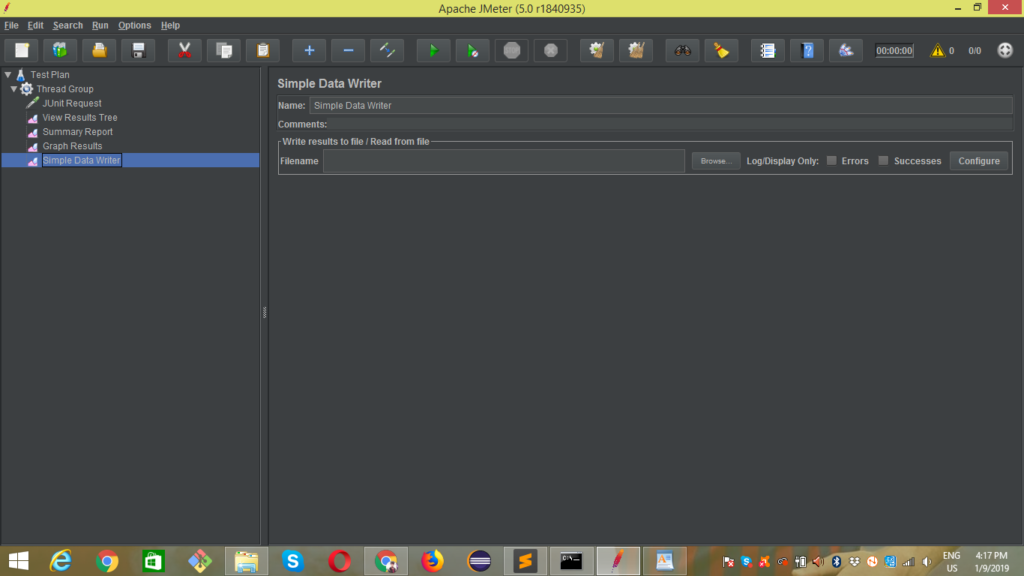

Steps to run the web driver script:
To import web driver script in the JUnit Request Sampler Note: Script jar file must be there in the JUnit folder of Apache JMeter.
- Open the JUnit Request sampler of the respective test plan.
- Search for JUnit 4 Annotations (instead of JUnit 3)
- Select class name from Classname drop-down, you will see your all classes inside the class name drop-down.
- Select the test method inside the Test Method drop-down, you will see all the test method present in the selected class name.
- We can update the Success message, Success code, Failure message, Failure code, Error message, Error code manually.
- We can append assertion errors, runtime exceptions in the JMeter console logs and log file.
To customize the Thread Group Property:
- We can customize the Thread Properties:
- We can increase or set the Number of users (Threads).
- The Ramp-up period can also be increased or set to a certain specific period.
- We can fix the Loop Count or set the thread group to Forever state.
- We can add the Scheduler Configuration to set duration and thread startup delay.
To create CSV file of all sampler results:
- Open the Simple Data Writer listeners.
- Select the folder to paste the CSV file from “Write results to file/Read from file” section.
To run the JUnit request:
- After selecting a test method and setting thread properties.
- To run the script, click on the “Run” button.
- Script will execute as per the thread properties and configuration.
- After successful test script execution, CSV or jtl file will automatically export into the selected folder in the above step.
To generate the HTML format or overall graph from CSV file the following can be done:
- Run the test in non-GUI mode and save the report as CSV or jtl format, using a command in JMETER_HOME/bin directory.


