Debugging a Roku App With BrightScript Debugger
Debugging a Roku App With BrightScript Debugger
20 May 2021
Debugging is a very important part in software development and testing. Debugging is necessary to find the crash logs and issues in the app. In this article we discuss the core features of BrightScript Debugger and how to use them. We assume that you have the basic knowledge about the debugging the roku channel, if not please first go through this article.
Hit the command in the terminal for accessing the debug console: telnet roku_device_ip 8085.
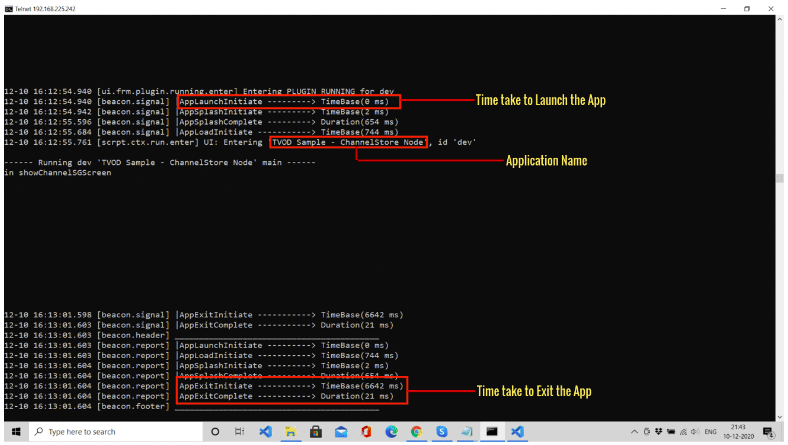
After opening the telnet, Launch your Roku Channel(App), you see the signal beacon logs(mentioned in the image below) in the debug console. Similarly signal beacon logs are also displayed in the console when you exit the app.
You can see how much time take to load the app in the debug console logs.
Now, move on the main topic that is Debugging of roku app with BrightScript Debugger.
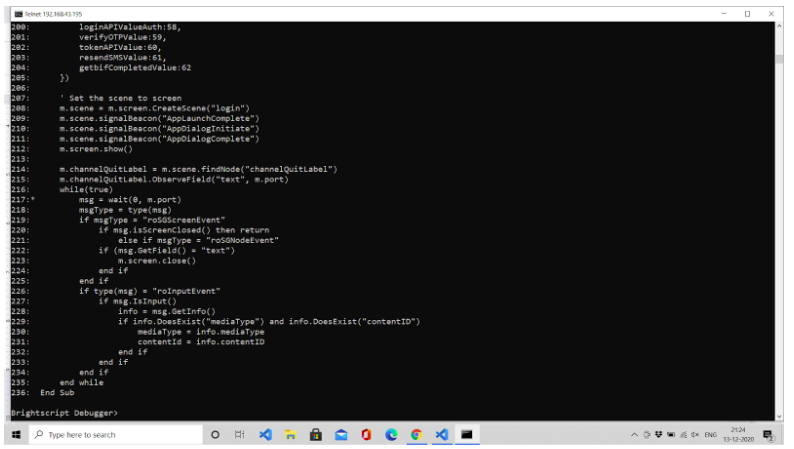

In the above image you can see the Brightscript Debugger in the last line of the terminal.
How to Open BrightScript Debugger?
Brightscript Debugger is automatically open in the terminal when any runtime error occurs in the roku app.
Ctrl+c: If the programmer wants to open the brightscript debugger then just press ctrl + c in the terminal to break the application and perform the debugging.
Stop: Also if the programmer needs to break the application at a particular line in the code to perform the debugging at that particular function then just write the STOP statement in that line and the app will automatically break on that line and the programmer debug the application at that specific area of the app.
Brightscript Debugging Commands?
Without any debugging commands, it was just running a car without a driver. Debugging is very difficult or you can not possible without these commands.
Here are some important brightscript commands:
Help: You can get the list of all commands and their working property by just typing the help command in the terminal.
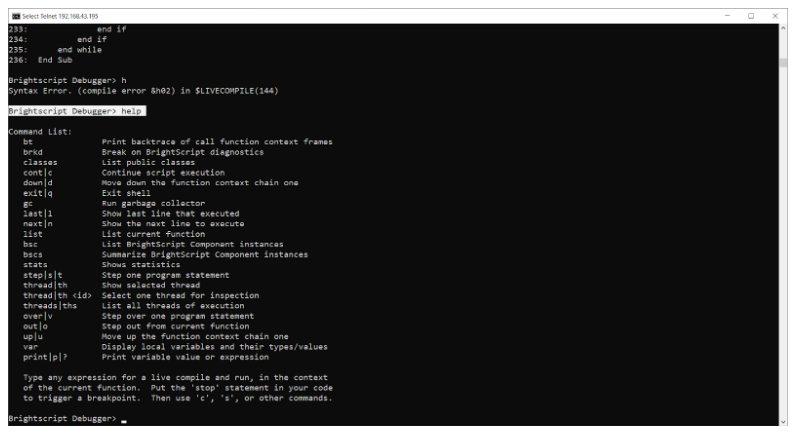

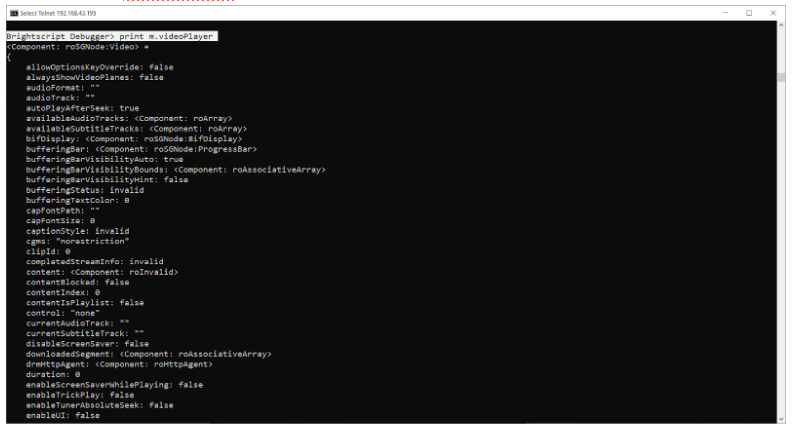
Print or P: By typing this command with any object or variable, you can get the value of that object. P or ? are also used for print the value of the objects. All three keywords are the same .
For example: Brightscript Debugger> print m.videoPlayer
This prints the m.videoplayer object(array) shown in the below image.

You can also print the expression e.g, print a=b it prints boolean value, if a equals b then prints true otherwise false.
Thread: Used to print the currently selected thread. And for print all the threads hit the Threads command.
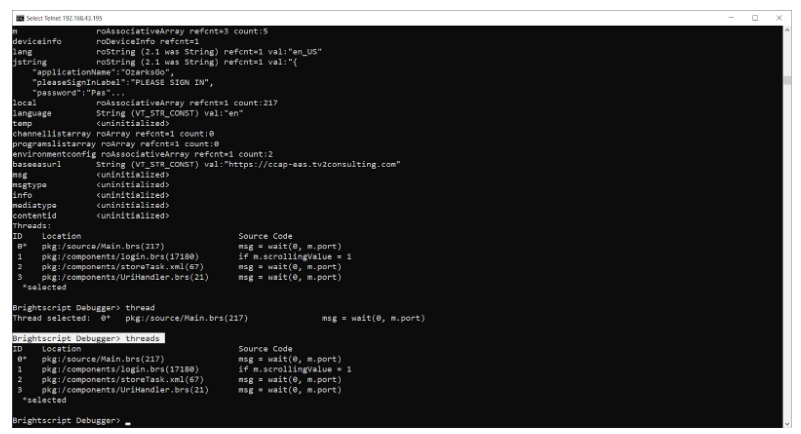

Also, if you want to switch the control to a particular thread just hit the thread <ID> command(shown in the below image.)
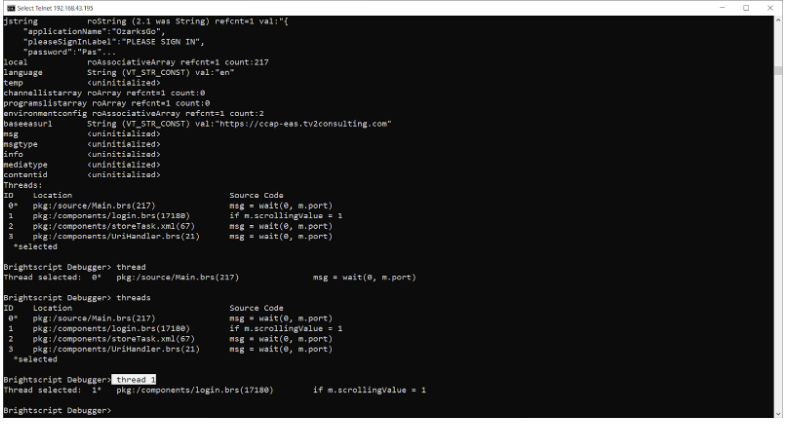

These above 3 commands are the most important commands for debugging any roku application. There are few more commands which is useful during the debugging.such as:
List: It prints the last executed function in the selected thread.
Last: It prints the last executed line in the selected thread.
Var: Prints all the local variables in the last executed function.
Bt: Print the backtrace of call function context frames.
Cont: Cont commands used to continue the script execution.
Next: Next command prints the next line to be executed.
Up: Move up the function context chain.
Down: Move down the function context chain.
You can get more info about brightscript debugger commands here.


