Overview
Tsung (formerly IDX-Tsunami) is a tool for checking distributed loads. It is protocol-independent, and can be used to monitor servers such as Ftp, WebDAV, SOAP, PostgreSQL, MySQL, AMQP, MQTT, LDAP and Jabber / XMPP.
Tsung’s aim is to simulate users to test the scalability and efficiency of client / server based applications based on the IP. You can use it to do server load and stress testing. Several protocols have been implemented and tested, and can be expanded easily.
It can be deployed on several client computers and can simulate hundreds of thousands of computer users simultaneously.
Tsung is written in Erlang, an open-source language created by Ericsson to construct scalable distributed fault tolerant applications.
Why is Tsung important?
The main strength of Tsung is its ability to simulate a large number of simultaneous users from a single machine; you can also spread the users for machines on a cluster. You can produce a really impressive load on a server with a modest cluster, easy to set up and maintain when used on cluster. You can use Tsung on a cloud such as EC2 too.
Tsung is built in Erlang and it is here that Tsung’s power resides.
Erlang is a language of programming which is targeted to competition. Tsung is based on the Erlang OTP (Open Telecom Platform) and has inherited many Erlang characteristics:
- Performance: Erlang was turned into a single virtual machine to support hundreds of thousands of lightweight processes.
- Scalability: Erlang runtime environment is naturally distributed, encouraging the concept of openness in the position of the process.
- Fault-tolerance: Erlang was designed to build robust, fault-tolerant systems. As such, wrong reply sent to Tsung from the server does not cause the entire running benchmark crash.
Benchmarking a Web server
- Record one or more sessions: Start the tsung-recorder, then configure your browser to use the Tsung proxy recorder (8090 is the listening port). Create a session log. Using http:/ instead of https:/ /in your browser to record HTTPS.
- Edit or arrange scenarios by inserting sessions that have been documented in the config file.
- If possible, write small code for dynamic sections, and place dynamic mark-ups in the scenario.
- Check and change scenario to get a good load progression. It depends heavily on the program, and the targetserver(s) size. Calculate the usual scenario length and use the user cycles and phase period to estimate the number of simultaneous users per phase.
- tsung start to Start the benchmark with first setup of application parameters.
- tsung stop for the end of the test.
- tsung status for a brief summary of the current activity.
Using the proxy recorder
- The recorder has three plugins for HTTP, WebDAV, and PostgreSQL.
- To start it, run tsung-recorder -p <PLUGIN> start, where PLUGIN can be http, webdav or pgsql for PostgreSQL. The default plugin is http.
- The proxy listens at port 8090.we can change the port with -L portnumber.
- To stop it, use tsung-recorder stop.
tsung.xml configuration file
-
File Structure
-
- The default encoding of tsung.xml configuration file is utf-8.
-
- The loglevel can also have a great impact on performance. For high load, warning is recommended.
- All the possible values of log level are:
- Emergency
- Critical
- Error
- Warning
- notice (default)
- Info
- Debug
-
Clients and server
- For the non-distributed load, a simple setup as follows:

- For the non-distributed load, a simple setup as follows:

- The ip scan method can be slow if you have many IPs (thousands of IP’s). In this case you can use the iprange tag to create a random IP within a given range:

- The maxusers parameter is used to override the maximum number of sockets accessed by a single process, and the select method call lacks scalability. When the number of users reached the capacity, a new virtual machine erlang can begin handling new users. Maxusers default value is 800

- For the non-distributed load, a simple setup as follows:
-
Defining the load progression
- The load progression is configured by specifying several phases of arrival:

With this configuration, a new user will be created every 2 seconds during the first 10 minutes of the test, then second user will be created during the next 10 minutes, and 10 users will be generated every second for the last 10 minutes. The test finishes once all users have ended their session. - You can also use the arrival rate, rather than the intervals. If you want 10 new users a second, for example, use:

- By using the maxnumber attribute, you can limit the number of users started for each process, just as follows:

In this scenario, in the first phase only 100 users will be created, and in the second phase 200 more will be created.
- The load progression is configured by specifying several phases of arrival:
-
Sessions
- Sessions themselves determine the substance of the scenario. We detail the conducting requests.
- Each session has a given probability. It is used to determine which session a new user performs. The sum total of the chances of all sessions must be 100.

You can use weights, rather than percentages. In the example above, there are twice as many Form s1 sessions as s2.
-
Thinktimes
- To separate requests, you can set static or random think-times. A random thinktime is by default an exponential distribution with mean equals to value.
- In this case, an exponential distribution with an average equal to 20 seconds will be the thinking time.

-
Reading data from file
- Accessing the data form the file through option tag as follows:

- Accessing the data form the file through option tag as follows:
Statistics and Reports
-
File format
-
- You can configure Tsung to use JSON format; however, the tools tsung stats.pl and tsung plotter do not work with JSON files in this case.
-
Available stats
-
- request: Response time for each request.
- page: Response time for each set of requests (a page is a group of request not separated by a thinktime).
- connect: Duration of the connection establishment.
- reconnect: Number of reconnection.
- size_rcv; Size of responses in bytes.
- size_sent: Size of requests in bytes.
- session: Duration of a user’s session.
- users: Number of simultaneous users (it’s session has started, but not yet finished).
- connected: Number of users with an opened TCP/UDP connection.
-
Generating the report
-
- You can use an embedded web server that the controller begins at port 8091.So if your controller is running on node0, use the http:/node0:8091/ URL in your browser, for example. It shows Tsung’s current status (see Dashboard), and produces the chart and graphs on the fly.
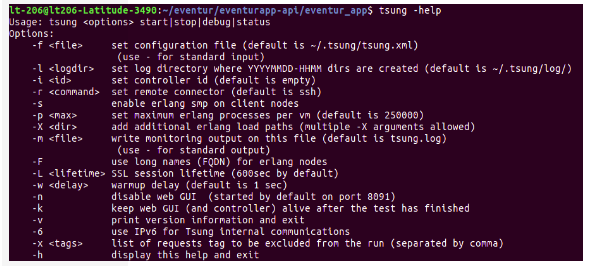
- use –help to view all available options:

-
Tsung summary
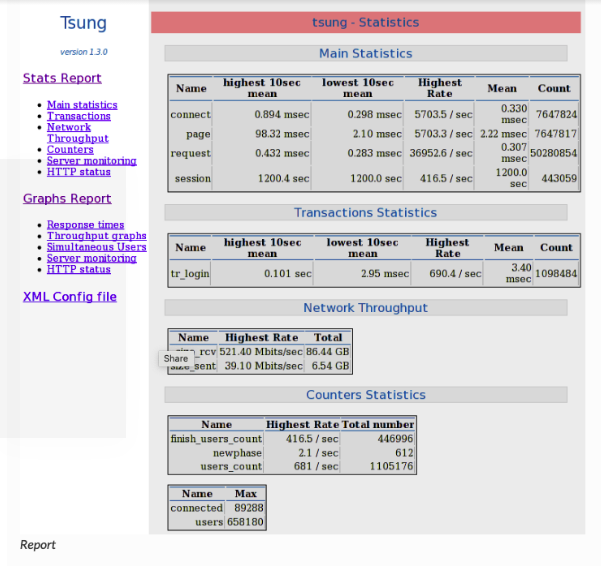
- An example of a summary report is shown in figure.

- An example of a summary report is shown in figure.
-
Graphical overview
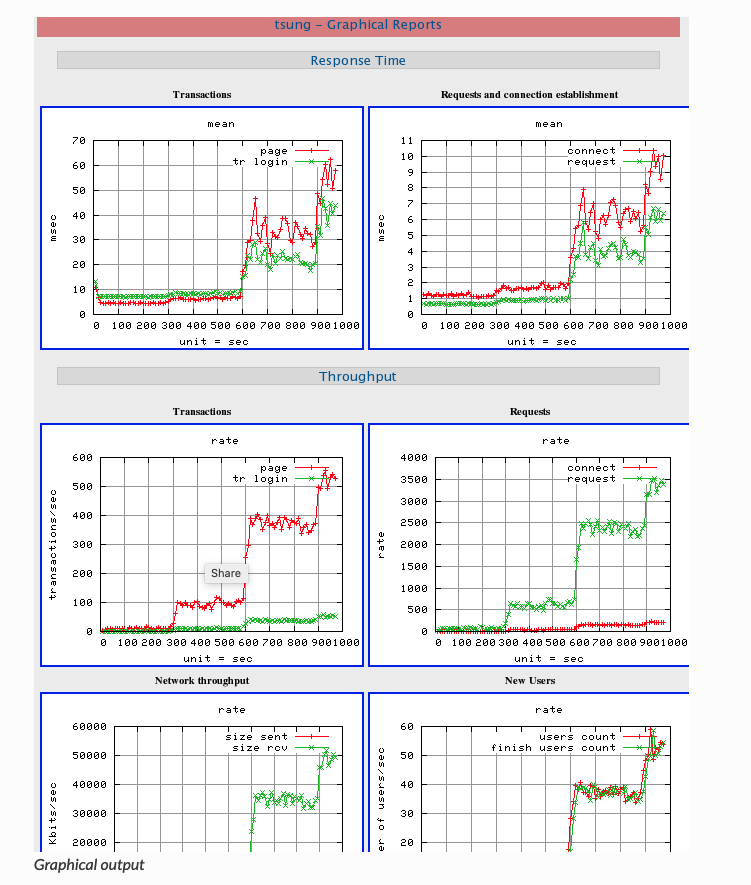
- An example of a Graphical output is shown in figure.

- An example of a Graphical output is shown in figure.
-
Tsung Plotter
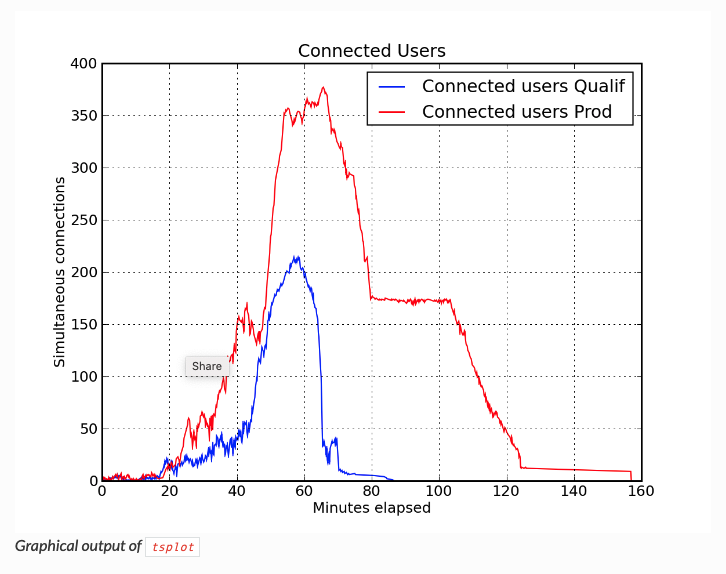
- Tsung-Plotter (tsplot command) is an optional tool recently added to the Tsung distribution (written in Python) that can be used to compare various tests run by Tsung. Tsplot can plot data from multiple tsung.log files on the same charts, for further comparison and analysis.
 Here’s an example of the charts generated by tsplot

- Tsung-Plotter (tsplot command) is an optional tool recently added to the Tsung distribution (written in Python) that can be used to compare various tests run by Tsung. Tsplot can plot data from multiple tsung.log files on the same charts, for further comparison and analysis.


