How to Trace APIs with Jaeger-Opentracing?
How to Trace APIs with Jaeger-Opentracing?
Introduction
“If you don’t have a microscope, you can’t see bacteria; and if you don’t have a telescope, you can’t see Jupiter. Jaeger is like that — both the big picture and the fine-grained details at the same time.”
Jaeger, inspired by Dapper and OpenZipkin, is a distributed tracing system released as an open-source by Uber Technologies. It is used for monitoring and troubleshooting micro services-based distributed systems.
Before delving into the core technical part, let’s simplify some terms.
Opentracing:
Opentracing is a hot topic for discussion among the developer community. In the course of this blog we will know what jaeger-opentracing all about is and why it is needed?
OpenTracing is an approach to enable reusable and vendor neutral instrumentation for distributed tracing system.
Here are some basic terminologies of Opentracing:
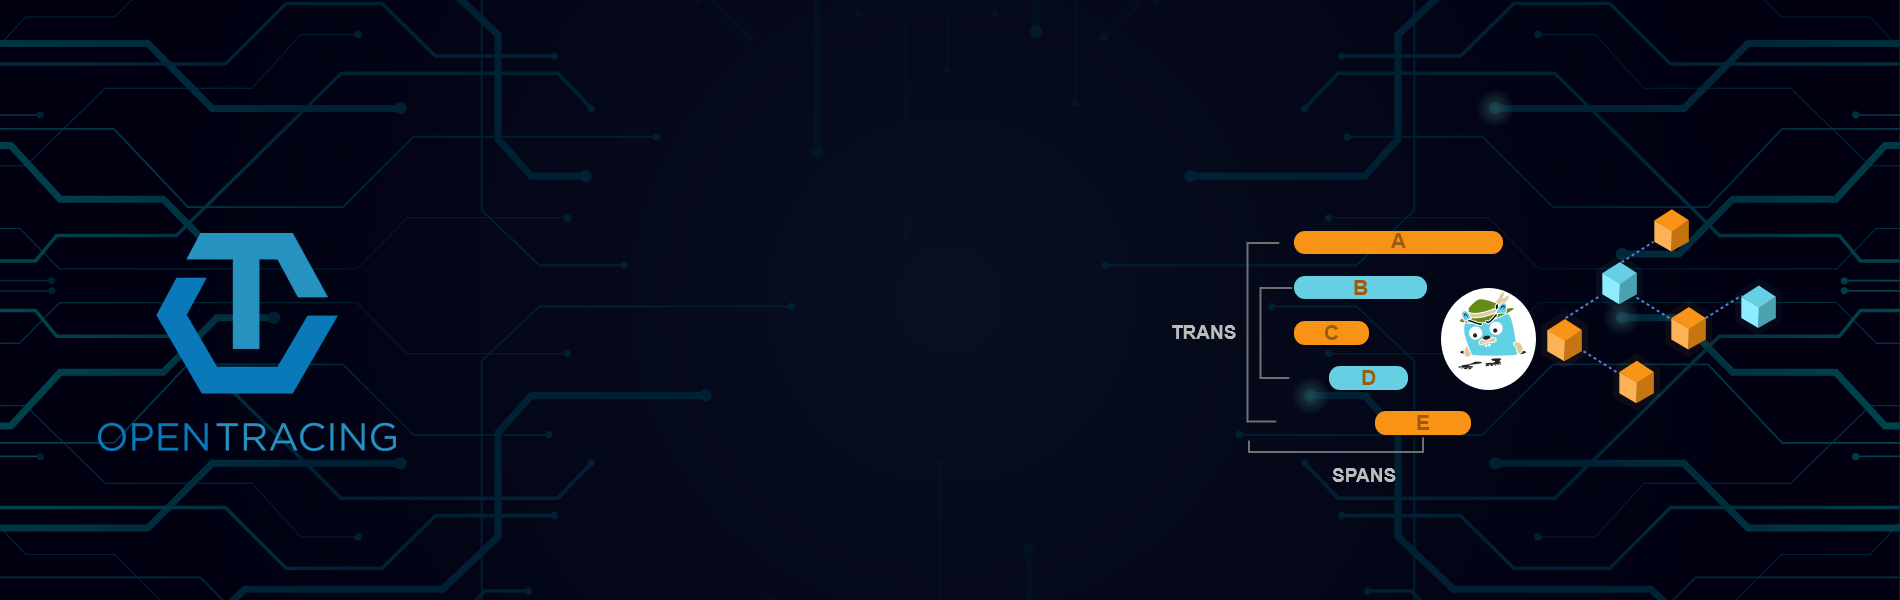
- Span: It is a logical unit of work with details like operation name, start time and duration to complete that work.
- Trace: It is simply a collection of spans belonging to the same service and sharing a common traceId. A single trace represents the vapour trail left behind by a request after it propagates through a distributed system. It gives you information about any HTTP requests, database calls. It is an useful tool for understanding the flow of application traffic and to spot any bottlenecks across a suite of micro services.

Fig. 1

Next we will learn about how distributed tracing system jaeger troubleshoots micro-service based applications.
In micro service architecture where millions of intervened services work together, it’s almost impossible to identify interdependencies of these services and execution pattern of HTTP requests. Even matrices and loggers cannot produce a depth overview of the system and adversely increases the system storage and affects system performance. A logging system (see Fig. 2) spreading out tons of similar statements does not help developers quickly find a root cause.

Fig. 2
Here we need some better tools to get in-depth understanding of micro service execution patterns and details like latency and slow queries.
Enough of theory, let move ahead and do some hands on.
Installation
The simplest way to start with jaeger is to use the pre-built image published to DockerHub.
docker run -d --name jaeger \

  -e COLLECTOR_ZIPKIN_HTTP_PORT=9411 \

  -p 5775:5775/udp \

  -p 6831:6831/udp \

  -p 6832:6832/udp \

  -p 5778:5778 \

  -p 16686:16686 \

  -p 14268:14268 \

  -p 9411:9411 \

  jaegertracing/all-in-one:1.7
or visit https://www.jaegertracing.io/download/#docker-images for other alternate installation options. After running image, we can then navigate to http://localhost:16686 to access the jaeger UI.
Opentracing APIs are supported by almost all client-libraries such as Go, Java, Node.Js, Python, C++ and C#. Currently, we will use Node.Js client-library to instrument our application.
Jaeger Bindings for OpenTracing API for Node.js
Jaeger-client Installation
npm install --save jaeger-client
-
Initializing a tracer:
const initJaegerTracer = require("jaeger-client").initTracer; function initTracer(serviceName) { const config = { serviceName: serviceName, reporter: { agentHost: "127.0.0.1", agentPort: "6831", collectorEndpoint: "http://127.0.0.1:14268/api/traces", }, sampler: { type: 'const', param: 1, } }; const options = { tags: { 'my-awesome-service.version': '1.1.2', }, logger: logger, }; return initJaegerTracer(config, options); } -
Instrumenting code with span:
const express = require('express');

const app = express();

const tracer = initTracer("hello-world");

app.get('/hello', (req, res) => {

let span = tracer.startSpan('/hello_api');

res.status(200).send("Hello World!")

span.finish();

})

app.listen(3000);
Here we used initTracer method to takes a service name as an argument and returns an initialized tracer with given custom configurations.
- Starting New Span:
let span = tracer.startSpan('/hello_api') - Adding Tags:
span.setTag('firstName', firstName) - Adding Logs:
span.log({event: "Response", message: "Success" }
- Starting New Span:
-
Run the Program:
const express = require('express'); const initJaegerTracer = require("jaeger-client").initTracer; function initTracer(serviceName) { const config = { serviceName: serviceName, reporter: { logSpans: true, agentHost: "127.0.0.1", agentPort: "6831", collectorEndpoint: "http://127.0.0.1:14268/api/traces", }, sampler: { type: 'const', param: 1, } }; const options = { tags: { 'my-awesome-service.version': '1.1.2' }, logger: logger, }; return initJaegerTracer(config, options); } const app = express(); const tracer = initTracer("hello-world"); app.get('/hello', (req, res) => { let span = tracer.startSpan('/hello_api'); let firstName = "David" span.setTag('firstName', firstName); res.status(200).send("Hello World!") span.log({ event: "Response", message: "Success" }); span.finish(); }) app.listen(8000); -
Jaeger UI:
Naviagate to http://localhost/16686 and check Jaeger UI, you can see a new service “hello-world” added.
Fig. 3
We can see that a new span with description “hello_api” is added to current trace. Make sure to end every span with span.finish() method. Click on span to check tags and logs.
Fig. 4


Conclusion
In this blog we learned about jaeger open-tracing and how it discover hidden part of our application. We also learnt how to setup jaeger client for nodeJs and instrumented API by starting span with tags and logs. Open tracing has a number of clients for different programming languages including C++, Java, Go, Python, PHP, and more.