Getting started with Prometheus
Getting started with Prometheus
30 July 2020
Prometheus is an open-source framework observing and alarming toolbox initially. Since its beginning in 2012, numerous organizations and associations have embraced Prometheus. It is presently an independent open source venture and kept up autonomously by any organization.
Prometheus is a checking stage that gathers metrics from monitored targets by scraping metrics HTTP endpoints on these objectives.
Prometheus data is stored in the form of metrics, with each metric having a name that is used for referencing and querying it. Each metric can be drilled down by an arbitrary number of key=value pairs (labels). Labels can include information on the data source.
Features
- Uses the metrics generated through the code in the key/value pairs.
- Easy to use the generated metrics at the Prometheus server.
- Once defined as the IP of the source it will automatically pull the metrics from there.
- Uses PromQL to operate on the metrics.
- Supports multiple graphing modes (Grafana etc.)
Components
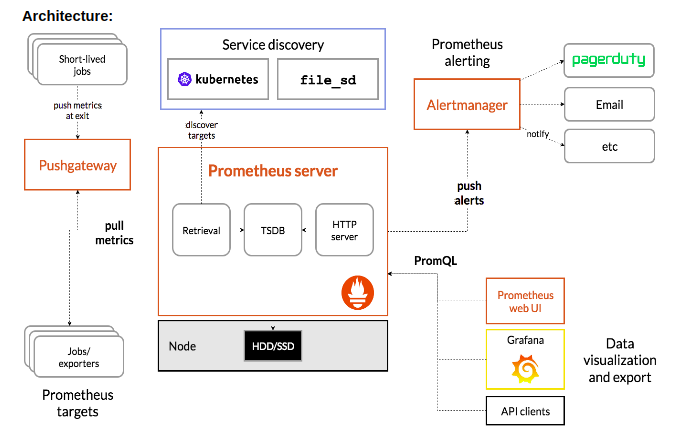
- The main Prometheus server which scrapes the time-series data.
- Rules file to define the conditions on generated metrics for alerting.
- Alertmanager to manage the alerts based on the severity of the alert generated.
- Also we can send notifications through Prometheus or we can use any webhook like Squadcast.
Visualization Layer with Grafana
You use Grafana, the visualization layer, as the 3rd component to visualize metrics stored in the Prometheus time-series database. Instead of writing PromQL queries directly into the Prometheus server, you use Grafana UI boards to query metrics from Prometheus server and visualize them in the Grafana Dashboard as a whole, as we will see in action shortly.
Downloading Prometheus
- Download Prometheus from here.
- tar xvfz prometheus-*.tar.gz
- cd prometheus-*
The Prometheus server is a solitary pair called Prometheus (or prometheus.exe on Microsoft Windows). We can run the parallel and see help on its alternatives by using the –help flag.
Configuring and run Prometheus
Prometheus configuration is YAML. The Prometheus download comes with a sample configuration in a file called prometheus.yml
Example of prometheus.yml:
  global:

  scrape_interval:     15s

  evaluation_interval: 15s

 rule_files:

  # - "first.rules"

  # - "second.rules"

  scrape_configs:

  - job_name: prometheus

    static_configs:

      - targets: [application’s IP: port on which metrics are scraped']
Command to run Prometheus:
./prometheus --config.file=prometheus.yml
Alert Management with Prometheus
Prometheus also has an alert management component called AlertManager for firing alerts via Email or other notification clients or using any webhook. You define the Alert Rules in a file called alert.rules through which the Prometheus server reads the alert configurations and fires alerts at appropriate times to the registered destinations via the Alert Manager component. For example, if the Prometheus server finds the value of a metric greater than the threshold that you defined in the alert.rules file for more than the time period you defined in the rules file, it will trigger the Alert Manager to fire an alert about the threshold and the metric.
How we implemented?
- First, we generated metrics from the application (Summary, Counter, Gauge).
- The generated metrics will have latency, status (success or failure), and their count.
- After that, we have to configure the application’s IP in the Prometheus server(or the IP from where the metrics will be pulled).
- Then on the Prometheus server, we have to define the rules to trigger the alerts.
- Once the rules have been defined we have to manage how we have to send the alerts to the users.
- There are many ways to send the alerts some are:
- To send the alerts from the Prometheus server itself.
- Or we can use a webhook like Squadcast to do the same.
- We can also use the generated metrics to create a graphical representation (like using Grafana)
Note: Use http://localhost:{port defined} in a browser to see the status of the metrics generated, alert conditions, and the status of the alerts(active/inactive/firing).


